

Spotting Boards 106: Data cleanup for game schedules from stats.ncaa.org
Scraping data is half the battle, but cleaning it up is the other half
The good news is: the last time we met, we taught you how to import tables straight off stats.ncaa.org! The bad news is: not all of that data is laid out in a clean, clear, presentable way that you’d want it on your spotting board.
Good news, again: that’s OK! There are many functions that can help you turn whatever your data set looks like into whatever you want it to look like.
To expedite things in today’s video, we’ll demonstrate how you can use A.I. to write a formula for you in Google Sheets. We’ll have A.I. perform some pretty basic, straightforward functions that require nesting, since nesting can take some practice. Those will be for a combination of the functions:
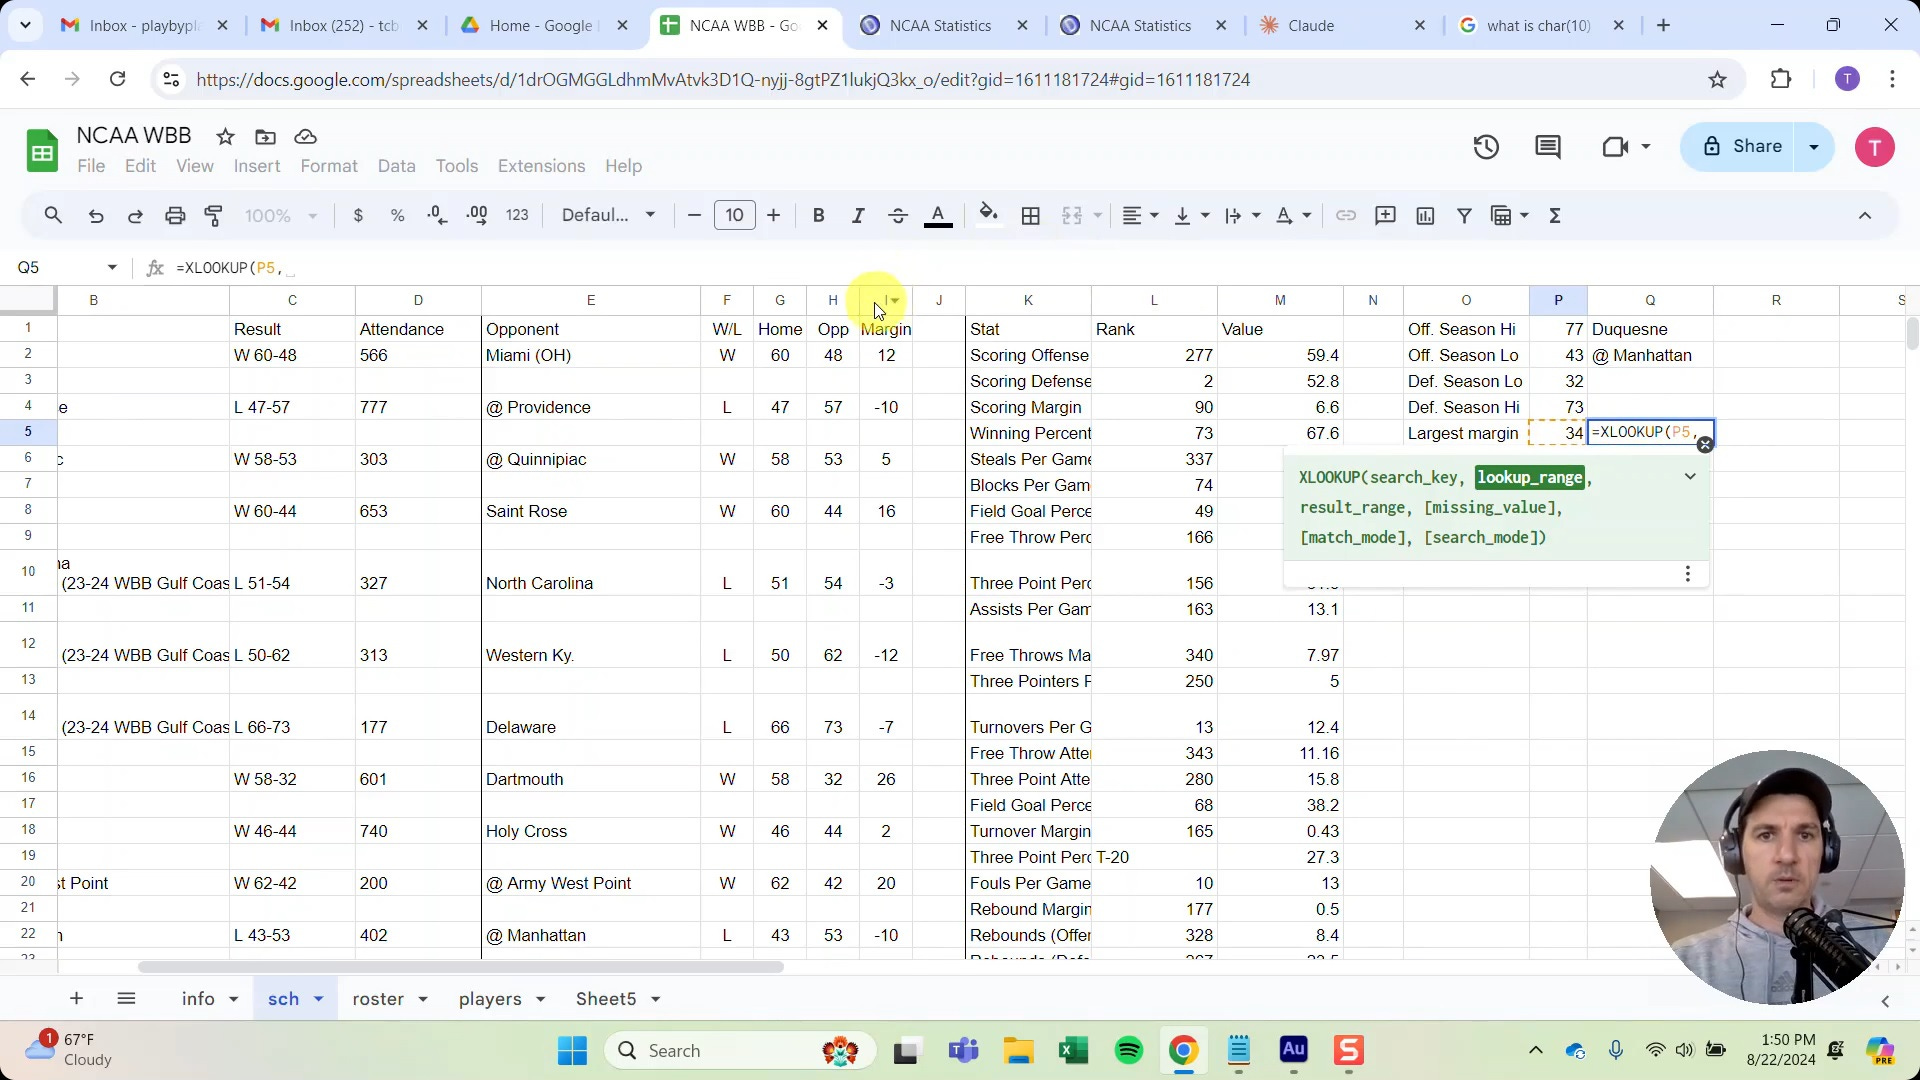
However, there are other very simple functions that can help turn some funky looking schedules into neat, clean tables where you can automatically return information like season highs, season lows, records in two-possession games, records at home, etc.
Those functions are: